In the dynamic world of customer loyalty, understanding and visualising the right metrics is the cornerstone of any successful programme.
As a loyalty consultant, I've witnessed numerous businesses transform their customer engagement and retention strategies by focusing on key metrics that accurately reflect their programme's performance. In this detailed blog post, we will explore these metrics, understand why they are important, and discuss how to effectively visualise and interpret them to enhance the success of your loyalty programmes.
The Importance of Loyalty Metrics
Loyalty programmes are not just about rewarding customers; they are strategic business tools designed to increase customer lifetime value and boost profitability. However, the success of these programmes hinges on the ability to track, analyse, and respond to various key performance indicators (KPIs). Metrics serve as the navigational beacons that guide decision-making and help pinpoint areas for improvement.
Key Metrics to Monitor
To decode the complexities of customer loyalty, here are the essential metrics every business should monitor:
1. Enrolment Rate
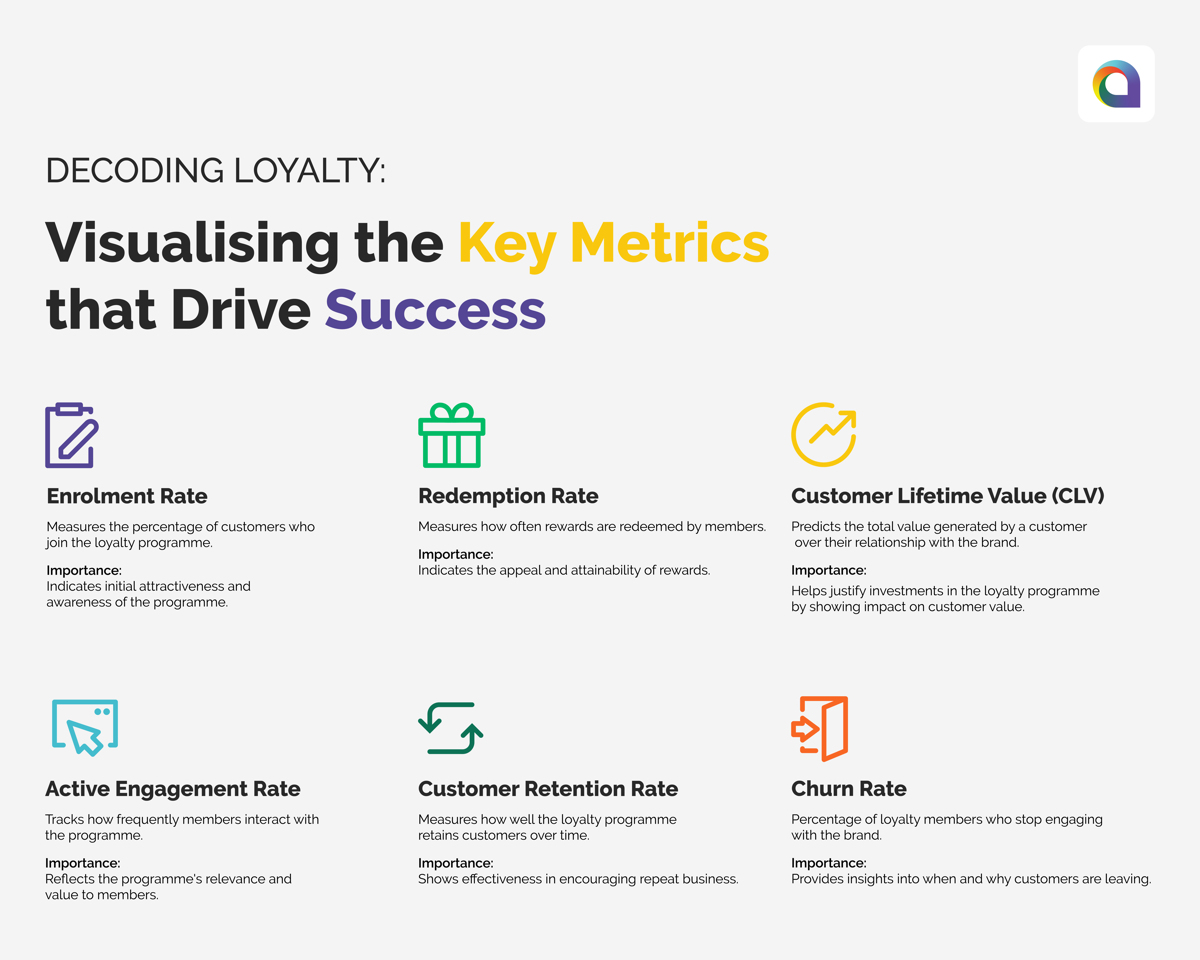
This metric measures the percentage of customers who sign up for your loyalty programme compared to your total customer base. A low enrolment rate may indicate a lack of awareness or perceived value of your programme, signalling the need for enhanced marketing efforts or programme adjustments.
2. Active Engagement Rate
Active engagement rate assesses how frequently enrolled members interact with your programme. This includes actions like earning and redeeming points, participating in promotions, and engaging with targeted communications. High engagement rates are often indicative of a programme's relevance and value to its members, which in turn can lead to higher customer satisfaction and retention.
3. Redemption Rate
The redemption rate is crucial because it shows how many rewards are being claimed by members. This metric is often a direct indicator of how compelling and attainable your rewards are. If redemption rates are low, it might suggest that the rewards are not appealing or that members find it too difficult to earn enough points to redeem them.
4. Customer Retention Rate
One of the primary goals of any loyalty programme is to retain customers. By measuring the retention rate specifically among loyalty programme members and comparing it to non-members, you can gauge how effective your loyalty initiatives are at encouraging repeat business.
5. Customer Lifetime Value (CLV)
CLV is a prediction of the total value generated by a customer over their entire relationship with your brand. Loyalty programmes should ideally increase CLV, which signifies not only prolonged engagement but also increased spending. This metric helps justify the investments in your loyalty programme by showcasing its impact on customer value.
6. Churn Rate
Churn rate is especially important as it helps identify the percentage of loyalty members who stop engaging with the brand over a specific period. Monitoring churn can help you understand when and why customers are leaving, providing insights into potential issues within the loyalty programme or broader business strategies.
Visualising and Interpreting Loyalty Data
Visualisation is key to interpreting the vast amounts of data generated by loyalty programmes. Here are some effective ways to visualise and make sense of these metrics:
1. Dashboards
Creating comprehensive dashboards that display real-time data on your loyalty programme’s KPIs can provide quick insights into its performance. These dashboards should be accessible and understandable, allowing both strategic planners and operational teams to make informed decisions.
2. Trend Analysis
Using line graphs or bar charts to track the performance of key metrics over time can help identify trends, such as seasonal variations in engagement or redemption activities. This analysis is crucial for forecasting and planning marketing activities around peak engagement times.
3. Segmentation Analysis
Divide your loyalty programme members into segments based on their behaviour patterns, demographic data, and purchase history. Visualising these segments through pie charts or heat maps can help you tailor your communications and rewards to suit different customer groups, enhancing personalisation and effectiveness.
4. Correlation Analysis
Investigate correlations between different loyalty metrics using scatter plots to understand how changes in one aspect of the programme might affect another. For example, analysing the relationship between engagement rates and CLV can reveal the true impact of active participation on overall customer value.
Implementing Insights for Programme Improvement
Once you have a clear visual representation of your data, the next step is to implement insights gained to improve your loyalty programme. This might involve adjusting your reward structures, enhancing customer communication strategies, or re-evaluating your point earning criteria. Regularly updating your programme based on data-driven insights will help maintain its relevance and effectiveness, keeping your customers engaged and loyal.
Conclusion
Loyalty programmes are complex mechanisms that require ongoing evaluation and adaptation. By focusing on the key metrics that drive success and utilising effective visualisation techniques, businesses can gain a deeper understanding of their customer base and enhance their loyalty strategies. Remember, the ultimate goal is to create a rewarding experience for your customers that encourages lasting relationships and drives sustainable business growth.
